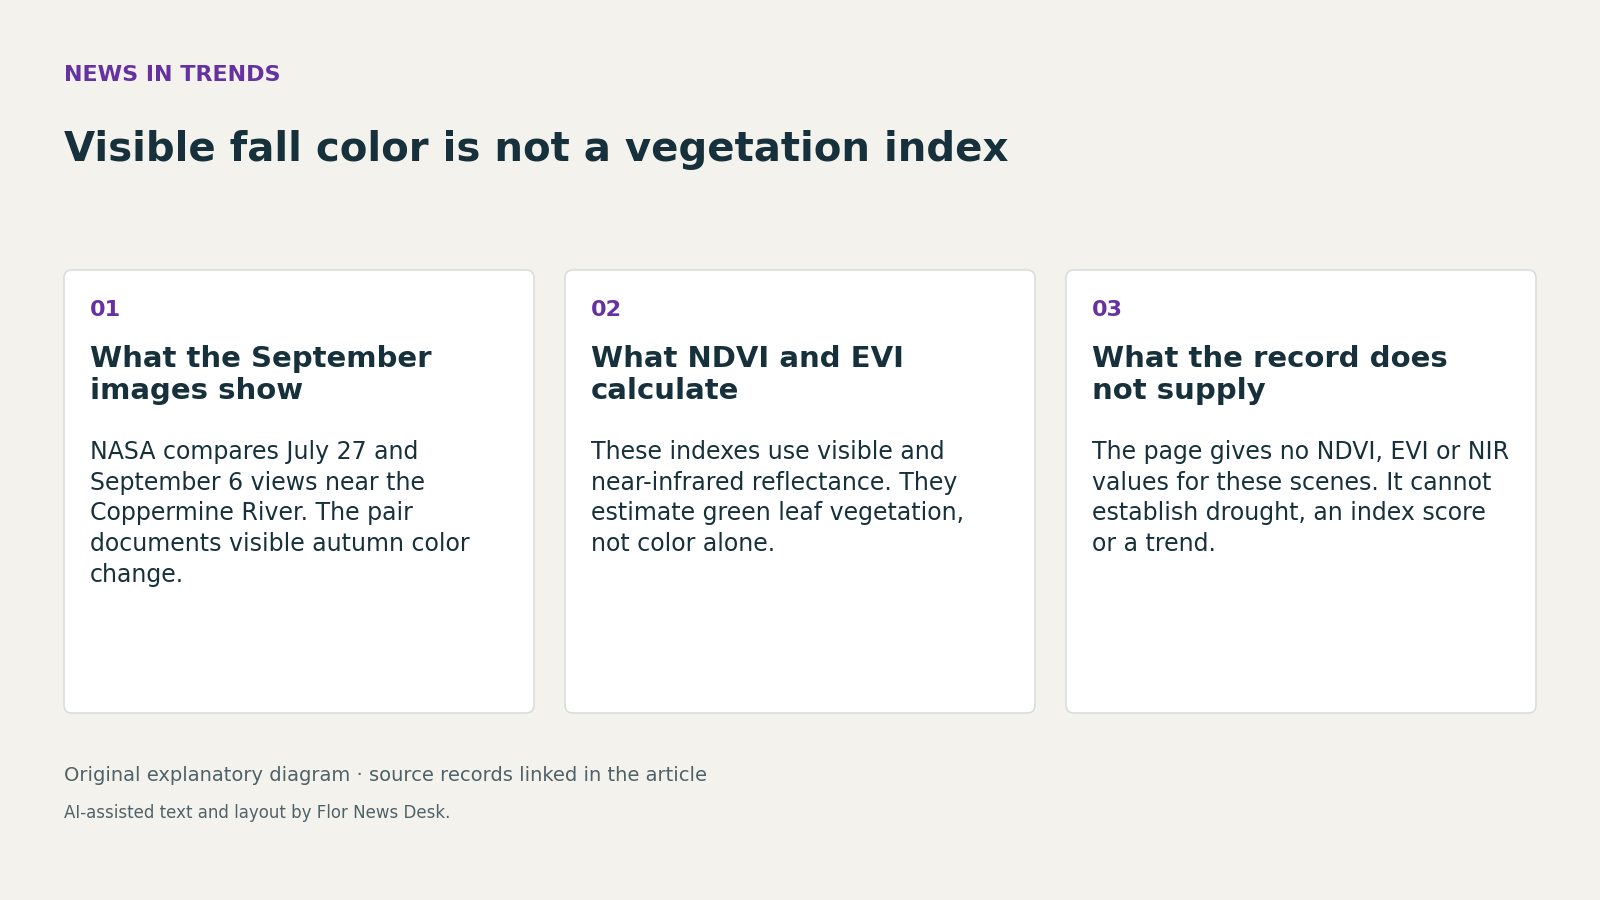
NASA’s September 14, 2026 Earth Observatory page about fall color near the Coppermine River is easy to read as a before-and-after measurement. It is more precise, and more useful, to read it as a comparison of two dated observations: Landsat 9 scenes acquired on July 27, 2026 and September 6, 2026, then published later as an Image of the Day on September 14, 2026 NASA image page. Those dates matter because the publication date is not the sensing date, and the page does not say it is showing a vegetation-index product.
What it does show is visible seasonal change. NASA says the July 27 scene still showed green vegetation, while the September 6 scene showed autumn colors across low-growing shrubs and tundra vegetation, and it explains that fall color appears as chlorophyll declines and other pigments become more visible NASA image page. That is a statement about appearance and plant pigments in the visible scene.
NDVI asks a different question. In NASA’s August 30, 2000 explainer, the index is calculated from reflected visible light and near-infrared light using the formula (NIR - VIS) / (NIR + VIS), and NASA says scientists use that contrast to quantify the concentration or density of green leaf vegetation NASA NDVI/EVI explainer. EVI is described there as a related calculation intended to correct for some effects from airborne particles and ground cover beneath vegetation NASA NDVI/EVI explainer. In other words, a fall-color image and a vegetation index can concern the same landscape without measuring the same property.
That distinction is why the September 14 page should not be used to derive an index number from the published color pair. The Coppermine River page provides no NDVI, no EVI, and no near-infrared band values for those two scenes NASA image page. Since NASA’s own explainer defines NDVI through visible-plus-near-infrared reflectance, the missing infrared data are not a minor detail; they are part of the measurement itself NASA NDVI/EVI explainer. Hypothetically, two places could look similarly orange in a published visible view while differing in near-infrared reflectance. A vegetation index could separate them, but the display image alone could not.
The older explainer also has to be handled carefully. Its publication date is August 30, 2000, and the briefed record notes later site metadata plus passages that still speak in the future tense about instruments and products from that period NASA NDVI/EVI explainer. That makes it solid background on method, but not a current instrument note for Landsat 9’s Operational Land Imager, which the explainer does not describe NASA image page NASA NDVI/EVI explainer.
The same caution applies to bigger claims. NASA’s fall-color page cites a NASA and South Dakota State University analysis of seven years of satellite data to explain why foliage change in that far northern region can begin in early September and peak in mid-month, with a short peak season NASA image page. But that cited study is background research, not a new September 2026 measurement. And NASA’s vegetation explainer says drought analysis involves NDVI anomalies relative to a baseline, while index maps can also be distorted by clouds, aerosols, sun glint, and instrument malfunctions NASA NDVI/EVI explainer. So the record here does not establish drought, an index score, or a climate trend from two visible scenes.
The practical takeaway is narrower and more interesting. The September 14 page documents that autumn color had become visible near the Coppermine River by September 6, 2026 NASA image page. The NDVI/EVI explainer shows how a different kind of satellite product would quantify green vegetation using visible and near-infrared reflectance NASA NDVI/EVI explainer. Same landscape, different evidence.